3 Steps to Awesome Test Reports with Cypress
December 18, 2019
In this article, you will learn how to generate informative test reports with Cypress and how to enrich them with some screenshot context. This will help you to fix your potential bugs way faster 😄 All you need is three simple steps.
At Egnyte we ❤️ to test
Keeping the highest possible quality of the product is one of our top priorities at Egnyte. That's why we love to test. But our applications are rather large and relying on manual testing would be exhausting for us. That's why test automation and Continuous Integration techniques are our best friends. We write a lot of tests: unit, integration, end-to-end, module, etc. The most important part is that, at the end of the day, if our Jenkins pipeline is green, we are sure that we didn't break any parts of the system.
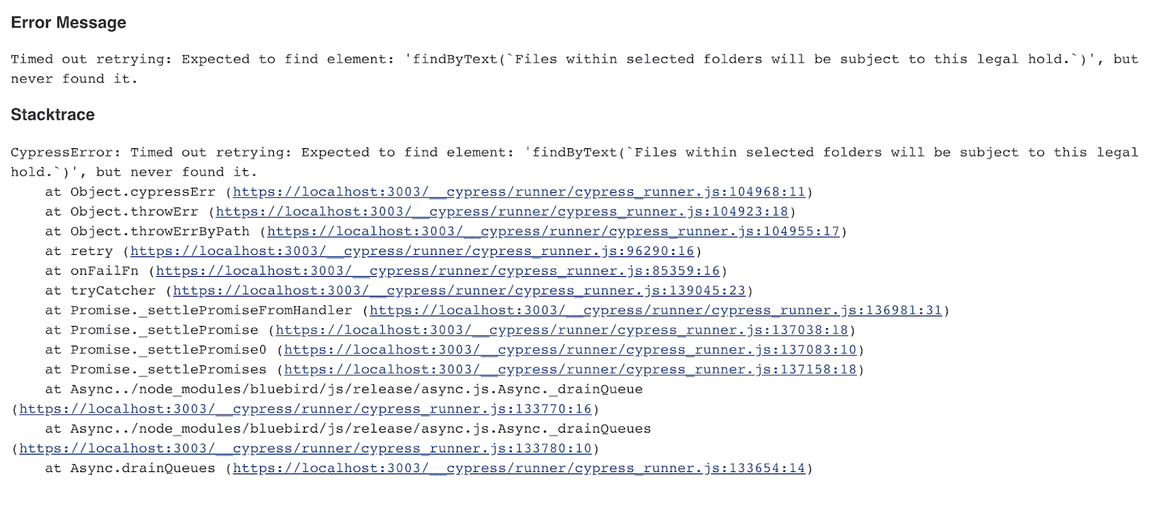
So where is the problem? Didn't you know that tests not always pass? And that's fine :) We don't need to panic right away. First, let's calm down, get into the test report on Jenkins, check what is broken, and fix it. That's it. The problem is that the test report is very often just a plain error message plus a stack trace. And it's enough for unit tests or integration tests for our React components, redux connections, and so on. On the other hand, this is not always helpful for tests that are run in the browser. Let's imagine the following result from a test:
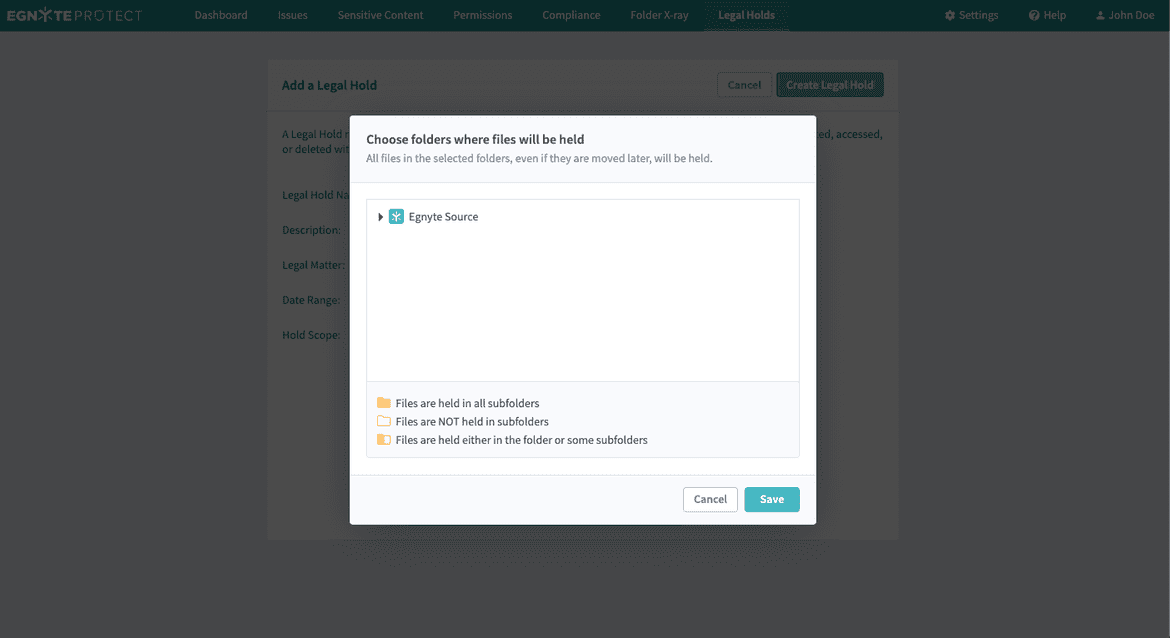
I took this failed test report from our data governance product (Egnyte Protect), which is one of our core products. For writing integration-UI tests, we use an awesome tool called cypress.io. I must admit that Cypress and cypress-testing-library are doing an excellent job in terms of error messages. Judging by the test report shown above, it is clear that we cannot find an element with matching text. Of course. But what is the visual state of the app? As a developer of Egnyte Protect, I know that this message should appear in a dialog. Has this dialog been opened? Or maybe it is only a typo? So many questions and no answers. If we wanted to check it, we would need to run the test locally once again and see what the visual state of the app is. Only then we would know (spoiler alert) that we have a typo :).
What if we displayed the visual state of the app right in the Jenkins report?
Wow! Now we know that the dialog is opened, and that the subheader text is incorrect! We have some valuable context just from reading the test report enriched with a single screenshot.
So how we could add screenshots to our test reports? Let's find out!
HTML reports to the rescue!
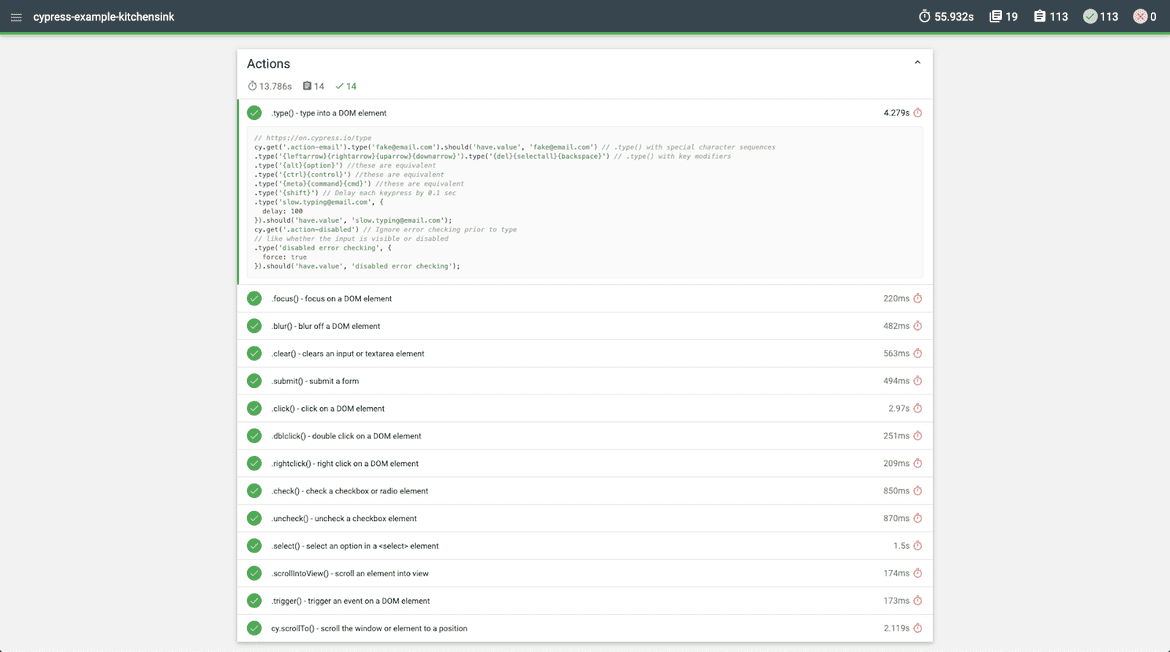
Cypress is based on mocha.js. And this is great because mocha.js is a very mature project with many custom extensions. Test results can be generated within elements called reporters. We can write our custom reporter or use an existing one, for example, mochawesome. As the name suggests, it generates AWESOME reports! Badum tsss.
And now, I would like to show you how to integrate mochawesome with cypress to generate HTML reports with a screenshot context for failed tests. For the sake of this blog post, I've used an example repo cypress-example-kitchensink. We will do it in 3 simple steps. Let's get our hands dirty!
Step 1 - set up the reporter
First, we need to install proper reporters. Yes, that's right - plural - reporters. We still want to see test results in the console. Maybe you also want to have a JUnit XML report. We need to have one reporter per expected outcome (console, HTML, XML). In order to set up many reporters, we will use the cypress-multi-reporters package. On top of that, we also need mocha and, of course, mochawesome.
npm install --save-dev mocha cypress-multi-reporters mochawesomeOr if you use yarn:
yarn add -D mocha cypress-multi-reporters mochawesomeThen, in the cypress.config file, we need to specify which reporter we want to use:
{
  "reporter": "cypress-multi-reporters",
    "reporterOptions": {
      "configFile": "reporter-config.json"
    }
}
The configFile field points to the reporters configuration file. We need to add this file to our repository. For each of the reporters we can specify some options. Let's do that for the mochawesome reporter:
{
    "reporterEnabled": "mochawesome",
    "mochawesomeReporterOptions": {
        "reportDir": "cypress/results/json",
        "overwrite": false,
        "html": false,
        "json": true
    }
}
In this fragment of config, we specify an output directory for the results file. We want to collect only the JSON files for each spec file. That's why the html flag has been set to false. Because cypress is able to run tests in parallel, we need to set the overwrite flag to false. It means that for each spec file, we will generate a separate file. In our case, these will be JSON files.
Let's try to run our tests via npm run local:run command.
Running:  examples/location.spec.js                                                      (9 of 19)
Location
    ✓ cy.hash() - get the current URL hash (169ms)
    ✓ cy.location() - get window.location (101ms)
    ✓ cy.url() - get the current URL (78ms)
3 passing (1s)
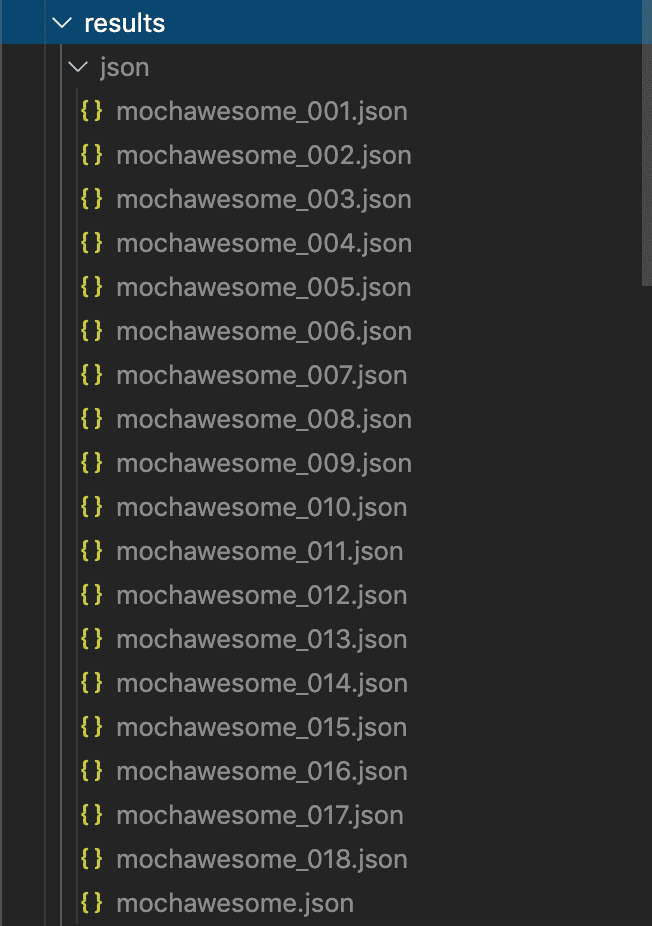
[mochawesome] Report JSON saved to /Users/przemuh/dev/cypress-example-kitchensink/cypress/results/json/mochawesome_008.json
As you can see, after the spec reporter results, we received information that the mochawesome_008.json file has been created. Each of the spec files generated a JSON with results.
We are ready to go to the next step.
Step 2 - generate the report
We've collected the test results. Now, we need to merge them into one file and generate an HTML report based on it. We will use the mochawesome-merge tool to merge result files. Let's install it.
npm i --save-dev mochawesome-merge
yarn add -D mochawesome-merge
Now, let's add an npm script which will be responsible for running the merge tool.
"report:merge": "mochawesome-merge --reportDir cypress/results/json > cypress/results/mochawesome-bundle.json"The reportDir flag specifies where we keep results files. The output of the command is passed from stdout to the mochawesome-bundle.json. One caveat here: the result of the merge needs to be put in a different folder than where the single results file is.
After merging we are ready to generate a final HTML report. In this case, we will use mochawesome-report-generator.
npm i --save-dev mochawesome-report-generator
yarn add -D  mochawesome-report-generator
Let's create an npm script for that action:
"report:generate": "marge cypress/results/mochawesome-bundle.json -o cypress/reports/html"Marge is a short form of MochawesomeReportGEnerator in case you've been wondering :)
Once the script has run, our awesome HTML report should appear in the cypress/results/html folder.
There is one more thing to do. Add a screenshot to tests that have failed.
Step 3 - add screenshot context
Cypress automatically generates screenshots for failed tests in the cypress/screenshots folder. You can disable this behavior if you want. Screenshots are collected within the following folder structure:
path-to-the-specfile/spec.file.js/context - describe - describe - testTitle (failed).pngFor example, the following test placed in examples/actions.spec.js:
context('Actions', () => {
  context("nested context", () => {
      it('.type() - type into a DOM element', () => {})
   })
})
will generate something like this on fail:

Ok, so how we can connect these two elements: a screenshot generated by Cypress and a test result generated by a mochawesome reporter?
First, let's copy our generated screenshots to the folder where we keep the HTML reports. In order to do this, we will use an npm script:
"report:copyScreenshots": "cp -r cypress/screenshots cypress/results/html/screenshots"Next, we will use the cypress/support/index.js file and write some code that will be listening on the test:after:run event.
Cypress.on("test:after:run", (test, runnable) => {
    if (test.state === "failed") {
        // do something
    }
});
For adding the screenshot to the test result, we need to use the addContext method from the mochawesome/addContext package. This method takes two arguments: an object with the test, and the context. If the context is a valid URL (could be a local path) to the image, then that image will be displayed. To see more details, visit the documentation page.
import addContext from 'mochawesome/addContext'

Cypress.on("test:after:run", (test, runnable) => {
    if (test.state === "failed") {
        const imageUrl = "?";
        addContext({ test }, imageUrl);
    }
});
Ok - but how to define the imageUrl? This is a time for magic to happen.

Just kidding :) we will use the runnable object. As we saw earlier, Cypress generates the name of the screenshot based on the test suite structure. We need to re-create that.
Cypress.on('test:after:run', (test, runnable) => {
  if (test.state === 'failed') {
    let item = runnable
    const nameParts = [runnable.title]

    // Iterate through all parents and grab the titles
    while (item.parent) {
      nameParts.unshift(item.parent.title)
      item = item.parent
    }

    const fullTestName = nameParts
            .filter(Boolean)
            .join(' -- ')           // this is how cypress joins the test title fragments

    const imageUrl = `screenshots/${
      Cypress.spec.name
    }/${fullTestName} (failed).png`

    addContext({ test }, imageUrl)
  }
})
From now on, if our test fails, a context field with a local URL to the image will appear in the JSON results file:
{
  "title": ".type() - type into a DOM element",
  "fullTitle": "Actions .type() - type into a DOM element",
  "timedOut": null,
  "duration": 10395,
  "state": "failed",
  "speed": null,
  "pass": false,
  "fail": true,
  "pending": false,
  "context": "screenshots/examples/actions.spec.js/Actions -- .type() - type into a DOM element (failed).png",
}
What is more, the image itself will be attached to the HTML report.
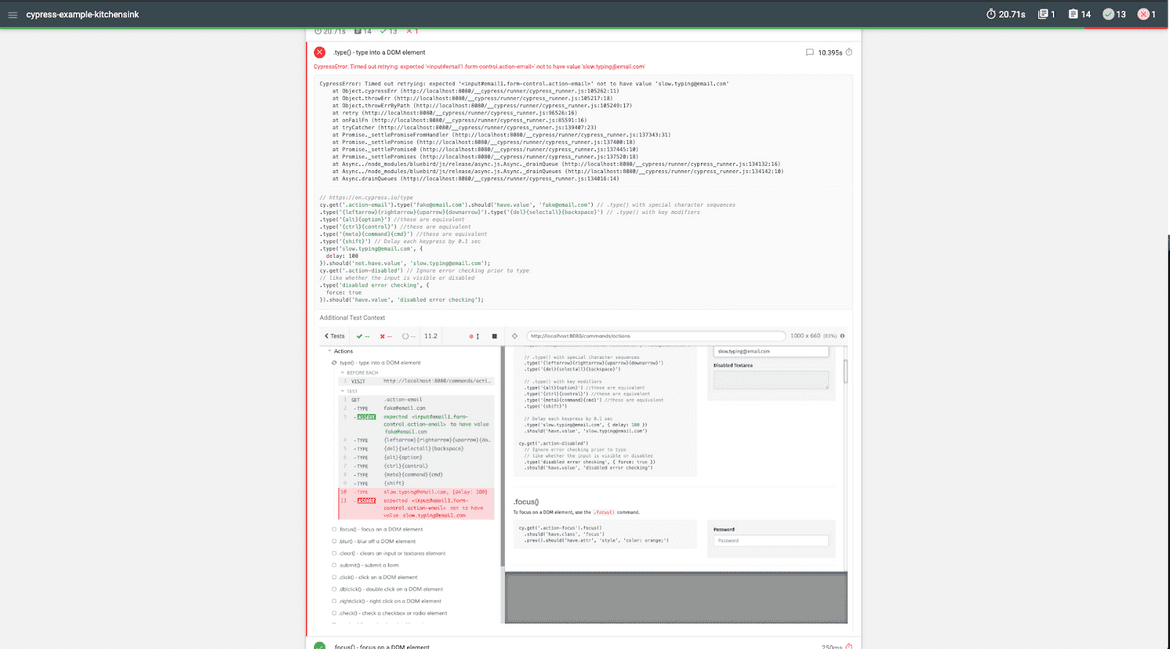
TADA 🎉 We got it!
You can check all necessary code changes that we have done in the following pull request: https://github.com/przemuh/cypress-example-kitchensink/pull/1/files
Optional steps
You might want to add cypress/results and cypress/reports folders to your .gitignore.
It would be good to remove screenshots, results, and reports before the next test run. It can be done by a simple npm script. In our example repo, I've added:
"precy:run": "rm -rf cypress/screenshots cypress/results cypress/reports""Pre" means that this script will be run before every cy:run. See npm docs for more details.
In the example repo, there is a npm-run-all package installed. We could use it to run in sequence: merge, generate report and copy screenshots scripts in one command:
"report": "run-s report:*",
"report:merge": "mochawesome-merge --reportDir cypress/results/json > cypress/results/mochawesome-bundle.json",
"report:generate": "marge cypress/results/mochawesome-bundle.json -o cypress/reports/html",
"report:copyScreenshots": "cp -r cypress/screenshots cypress/reports/html/screenshots"
There is also one caveat. The file name in most systems is limited to 255 characters. So what will happen when we have a very nested structure of a test suite with long descriptions? It's simple - our file name will be truncated. Cypress truncates the full test name to 220 characters. So we could also do the same in our code:
const MAX_SPEC_NAME_LENGTH = 220;
const fullTestName = nameParts
    .filter(Boolean)
    .join(" -- ")
    .slice(0, MAX_SPEC_NAME_LENGTH);
But this is an implementation detail. We don't know whether Cypress devs are about to change that number. So, a better option would be to read an article from Kent C Dodds about avoiding nesting when you are testing.
Wrap-up time
I hope that this article will help you to set up awesome HTML reports in your project. It helps us a lot when it comes to quick investigations of why a given test is failing. Let's recap what we did here:
- Install and set up the mochawesome reporter.
- Collect test results and generate an HTML report based on the merged JSON file
- Add screenshot context with an
addContextfunction.
You can check all code changes here in this pull request. And of course, after you generate the HTML report you need to connect it somehow to your Continuous Integration tool. But this is a story for a separate post. :)
Now…are you ready to create your own Cypress HTML reports?
